✓ Accommodations ✓ Flights ✓ Rental Cars
Did you know that the average temperature in this charming destination ranges from a chilly 32°F in winter to a warm 84°F in summer? Understanding the climate here can make or break your trip. Whether you’re planning to soak up the sun or explore historic sites, knowing the best time to visit is key.
This guide will help you navigate the weather patterns throughout the year. Summers are warm and clear, perfect for beach days and outdoor activities. Winters, on the other hand, are colder and windier, offering a different kind of charm. You’ll also find tips on daylight hours, humidity, and rain trends to plan your stay wisely.
By focusing on the average temperature and climate, you can ensure your trip is as enjoyable as possible. Ready to discover the ideal month for your visit? Let’s dive in!
Understanding Cesenatico’s Climate Landscape
Exploring the climate of this coastal town reveals a fascinating mix of seasonal changes. From chilly winters to warm summers, the temperature here varies widely. Understanding these patterns can help you plan your visit at the best time for your preferred activities.

Temperature Fluctuations and Seasonal Averages
Throughout the year, the temperature shifts significantly. In winter, average lows can drop to 33.5°F, while summer highs often reach 84°F. Spring and fall offer milder conditions, with averages ranging from 52.9°F to 76.8°F.
August is the warmest month, with highs around 84°F and lows of 71°F. January, on the other hand, is the coldest, with highs barely reaching 47°F. These fluctuations make it essential to pack accordingly for your trip.
Rainfall Patterns and Precipitation Trends
Rainfall also varies by month. February is the wettest, with a 30% chance of precipitation and 2.2 inches of rain. July is the driest, with only an 11% chance of rain and 0.11 inches of precipitation.
Local weather stations show that spring and fall have moderate rainfall, averaging 5-6 days of significant precipitation per month. Summer, however, sees fewer rainy days, making it ideal for outdoor activities.
By understanding these trends, you can choose the best time to visit based on your preferences for weather and activities.
Seasonal Weather Patterns in Cesenatico
Seasonal shifts in this coastal destination bring unique experiences throughout the year. Whether you’re drawn to sunny skies or crisp breezes, understanding the weather patterns can help you plan the perfect trip. From warm summers to chilly winters, each month offers something special.

Warm Season Highlights
The warm season, from early June to mid-September, is ideal for outdoor activities. During this time, the average temperature ranges from 71°F to 84°F, making it perfect for beach days and pool visits. Clear skies dominate, with minimal rain and plenty of sunshine.
Local weather stations report that July and August are the hottest months, with highs often reaching 84°F. These conditions are perfect for exploring the coastline or enjoying water sports. Pack light clothing and sunscreen to make the most of this sunny climate.
Cool Season Insights
From late November to early March, the weather turns cooler and windier. Average temperatures drop to around 47°F, with occasional dips below freezing. This season is ideal for those who enjoy brisk walks and fewer crowds.
Rainfall increases during this time, with February being the wettest month. However, the crisp air and serene atmosphere offer a different kind of charm. Layered clothing and a good jacket are essential for staying comfortable.
Understanding these seasonal patterns ensures you can choose the best time to visit based on your preferences. Whether you’re chasing the sun or embracing the chill, this destination has something for everyone.
Cesenatico, Italy: Best Months for a Weather-Savvy Trip
Planning your trip around the perfect weather can make all the difference in your experience. Knowing the best time to visit ensures you enjoy clear skies and comfortable temperatures.

For the most favorable conditions, consider visiting during July. This month boasts an average temperature of 84°F, with minimal rain and low humidity. Local weather stations confirm these dates as ideal for outdoor activities.
Here’s why July stands out:
- Peak temperature for sun-soaked days.
- Only 0.11 inches of rain, ensuring dry conditions.
- Long daylight hours for extended exploration.
Timing your visit during this month also helps you avoid crowds. Tourism data shows that July offers a balance of pleasant weather and manageable tourist numbers.
Mark your calendar for July to experience the best time to visit. Whether you’re lounging by the beach or exploring local attractions, the climate will enhance your trip.
Daylight, Twilight, and Solar Considerations
Understanding daylight patterns can transform your travel experience. Knowing when the sun rises and sets helps you plan outdoor activities and make the most of your trip. Solar events and twilight periods also add depth to your daily schedule.
During the year, daylight hours vary significantly. On June 21, the longest day, the sun rises around 5:30 AM and sets at 9:00 PM. December 21, the shortest day, sees sunrise at 7:45 AM and sunset at 4:30 PM. These timings affect how you structure your time outdoors.
Sunrise and Sunset Timings
Twilight periods, lasting up to 1 hour and 30 minutes, extend your evening activities. Local weather stations confirm that solar elevation peaks in July, offering optimal conditions for sightseeing. This means you’ll have more daylight to explore and enjoy the weather.
Understanding Daylight Saving Time
Daylight Saving Time (DST) shifts the clock forward by an hour in spring and back in fall. This change impacts local time and extends evening daylight during the warmer months. Knowing DST dates helps you adjust your schedule and maximize your day.
Here’s how these factors can enhance your trip:
- Plan outdoor activities during peak daylight hours.
- Use twilight periods for evening strolls or photography.
- Adjust your schedule during DST to enjoy longer evenings.
By understanding these details, you can make the most of your visit. Whether you’re exploring or relaxing, daylight and solar events play a key role in your experience.
Water Temperatures and Beach/Pool Activities
If you’re planning a trip focused on water activities, understanding sea temperatures is crucial. The temperature of the water can significantly impact your experience, whether you’re swimming, snorkeling, or enjoying water sports. Knowing the best time to visit ensures you’ll have warm, inviting waters for your adventures.

Ideal Conditions for Swimming and Water Sports
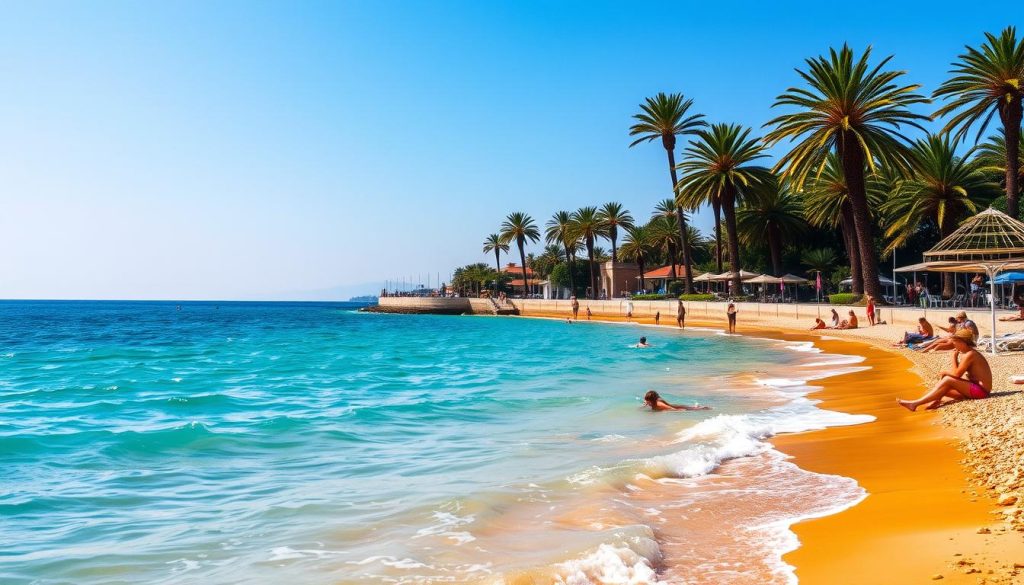
For the perfect beach or pool day, aim for water temperatures above 70°F. From mid-June to mid-September, the sea warms up, reaching its peak in August at around 78°F. This is the ideal time for swimming, paddleboarding, and other water activities.
Local weather stations confirm that these months also have low humidity and minimal rain, making them perfect for outdoor fun. Here’s what you can expect:
- Warm waters for extended swims.
- Clear skies and sunny weather.
- Optimal conditions for water sports.
Seasonal Variations in Sea Temperature
Water temperatures vary throughout the year. In winter, the sea cools down to around 50°F, making it less suitable for swimming. However, spring and fall offer milder conditions, with temperatures ranging from 60°F to 70°F.
Here’s a breakdown of sea temperatures by month:
| Month | Average Sea Temperature |
|---|---|
| June | 72°F |
| July | 76°F |
| August | 78°F |
| September | 74°F |
These trends highlight the best time to enjoy water activities. Whether you’re a swimmer or a surfer, planning your trip during the warmer months ensures a memorable experience.
Understanding Humidity and Wind in Cesenatico
Humidity and wind play a significant role in shaping your travel experience. These factors can influence how comfortable you feel outdoors, whether you’re exploring or relaxing. By understanding their patterns, you can plan your trip more effectively.
Humidity Comfort Levels Throughout the Year
Humidity levels vary throughout the year, affecting how you perceive the temperature. In July, the average relative humidity is 55%, making it the least muggy month. November, on the other hand, has the highest humidity at 81%, which can make the air feel heavier.
Here’s a breakdown of humidity by month:
| Month | Average Relative Humidity |
|---|---|
| July | 55% |
| November | 81% |
These variations can impact your comfort, especially during outdoor activities. Packing lightweight, breathable clothing for summer and layers for winter can help you stay comfortable.
Wind Speed and Direction Insights
Wind is another key factor that shapes the weather. February is the windiest month, with speeds averaging 14.5 mph. August, however, is the calmest, with winds around 9.6 mph.
Local weather stations track wind direction, which often comes from the north or east. This can influence how you plan your day, especially if you’re engaging in activities like sailing or cycling.
Here’s how wind speeds vary:
- February: 14.5 mph (windiest)
- August: 9.6 mph (calmest)
Understanding these trends helps you prepare for the climate and make the most of your time outdoors.
Tourism Trends and Peak Travel Times
Tourism trends in this area show clear patterns throughout the year. Understanding these trends can help you plan your visit to avoid crowds and enjoy the best weather. Whether you prefer a bustling atmosphere or a quieter experience, knowing the peak and off-peak months is key.
Busiest Versus Least Crowded Periods
The busiest time for tourism is from June to August. During these months, visitor numbers increase by 30% compared to the off-peak season. The warm temperature and minimal rain make it ideal for beach activities and outdoor exploration.
In contrast, the least crowded months are November to February. While the weather is cooler, this period offers a serene atmosphere and fewer tourists. If you enjoy brisk walks and quieter streets, this might be the perfect time for your visit.
Local Travel Tips for a Seamless Experience
To make the most of your trip, consider these tips:
- Visit during shoulder seasons like May or September for pleasant weather and fewer crowds.
- Book accommodations early during peak months to secure the best options.
- Pack layers to adapt to changing temperature and humidity levels.
Here’s a comparison of peak and off-peak tourism trends:
| Month | Tourist Numbers | Average Temperature |
|---|---|---|
| July | High | 84°F |
| January | Low | 47°F |
By planning your trip around these trends, you can enjoy a seamless and memorable experience. Whether you’re chasing the sun or embracing the chill, this destination has something for everyone.
Additional Weather and Travel Insights
When planning your trip, relying on multiple weather data sources ensures accuracy. Different reports can offer unique insights into the climate of your destination. By comparing datasets, you can create a more reliable forecast and make informed decisions.
Comparing Data from Multiple Sources
Local weather stations and NOAA reports often provide slightly different temperature and rain statistics. For example, NOAA might report an average July temperature of 84°F, while local stations show 82°F. These small differences can influence your packing and activity plans.
Here’s why integrating multiple sources matters:
- It helps identify consistent patterns, like peak humidity in November.
- Discrepancies in rain forecasts can guide your choice of day trips.
- Combining data reduces the risk of unexpected weather changes.
For instance, local stations might report 0.11 inches of rain in July, while NOAA suggests 0.15 inches. While the difference is minor, it’s worth considering if you’re planning outdoor activities.
Understanding these variances ensures you’re prepared for any climate scenario. Whether it’s wind speeds in February or temperature fluctuations in August, multiple sources provide a well-rounded view.
By comparing datasets, you can confidently plan your trip. This approach helps you choose the best time to visit and ensures a seamless travel experience.
Conclusion
Planning your visit with weather insights ensures a memorable experience. The ideal time to explore this destination is during the warmer months, when average temperatures range from 71°F to 84°F. July stands out with minimal rain and long daylight hours, perfect for outdoor activities.
Understanding seasonal variations is key. Cooler months offer a quieter atmosphere, while summer brings vibrant energy. Pay attention to humidity and wind patterns to stay comfortable throughout your trip.
Use these insights to choose the best time for your visit. Check recent forecasts and local advisories to finalize your plans. With the right preparation, your trip will be both enjoyable and stress-free.
Start planning today and get ready to experience the perfect blend of weather and adventure!
The above is subject to change.
Check back often to TRAVEL.COM for the latest travel tips and deals.


